Title here
Summary here

This page shows how to use the Meshalyzer visualization tool.
If your results were generated using Chaste, then you will find the meshalyzer
output within a subdirectory of your results directory called output.
The files that describe the geometry are:
FILENAME_mesh.pts (the nodes of the mesh you used in your simulation)FILENAME_mesh.tri and FILENAME_mesh.tetras (the connections between the nodes)The output data of your simulation are in files called
FILENAME_VARIABLENAME.datwhere you will have as many files as output variables (typically the unknowns) of your simulation.
First thing to do is to fire up the meshalyzer executable you downloaded. Simply open a terminal and type the path to the meshalyzer executable. You will be prompted with a window like this one
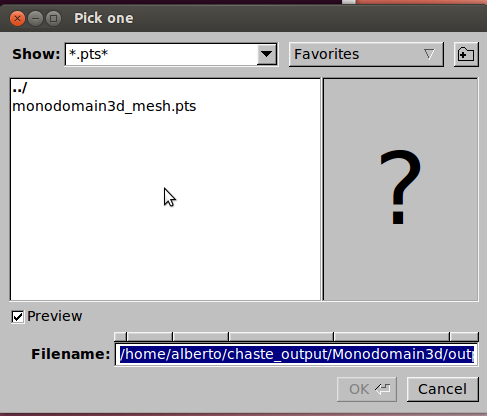
where you will be asked to choose a mesh file. Navigate your way to your simulation results directory (output sub-directory) until you find the .pts file that describes the geometry of your simulation. Select it and click OK. This will pop up two windows that look like this at first
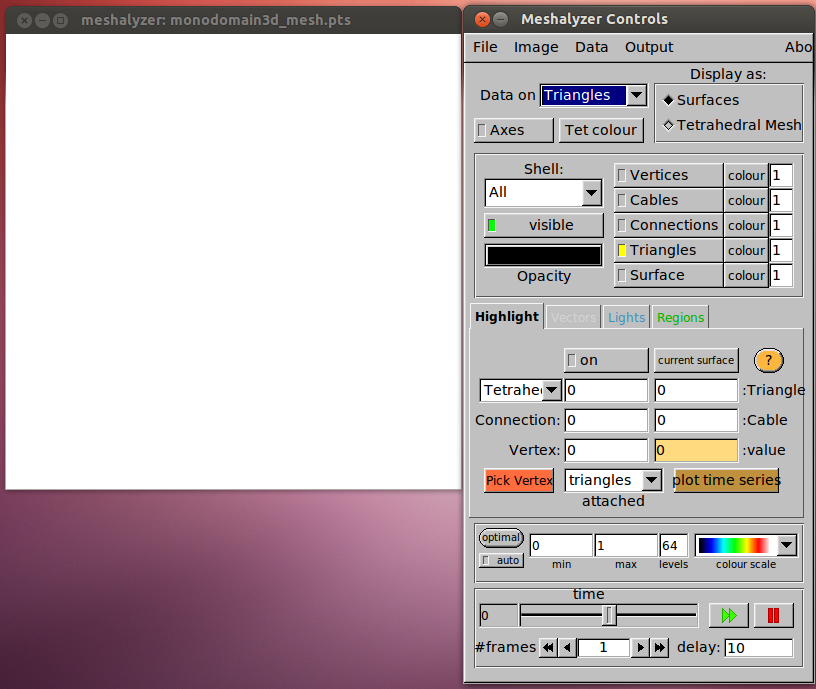
the one on the right is the Control Panel. The one on the left is where the visualization will occur. At the moment that is blank. To view the geometry, simply click on the Vertices Button as shown here
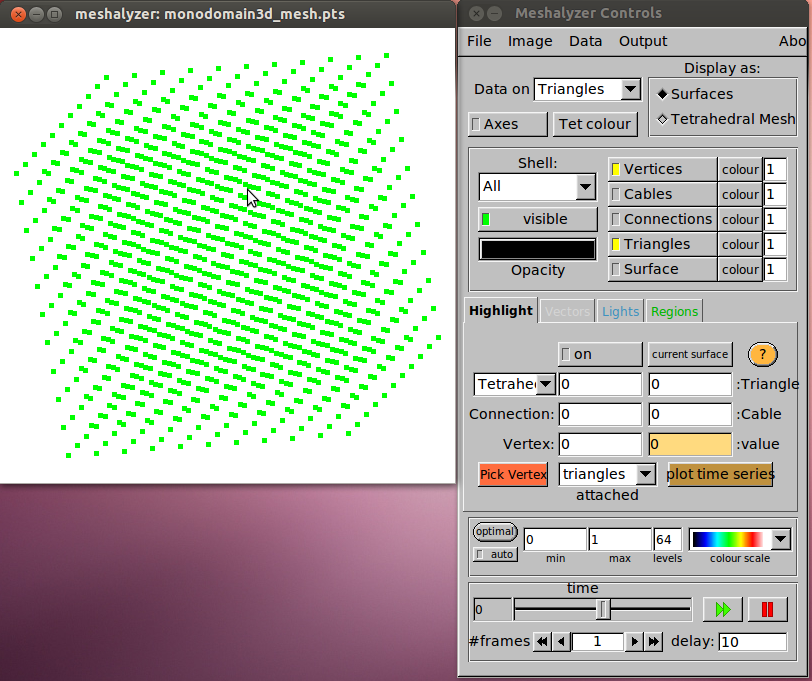
in this example, the geometry is just a cube. The mouse buttons for meshalyzer visualization window are as follows:
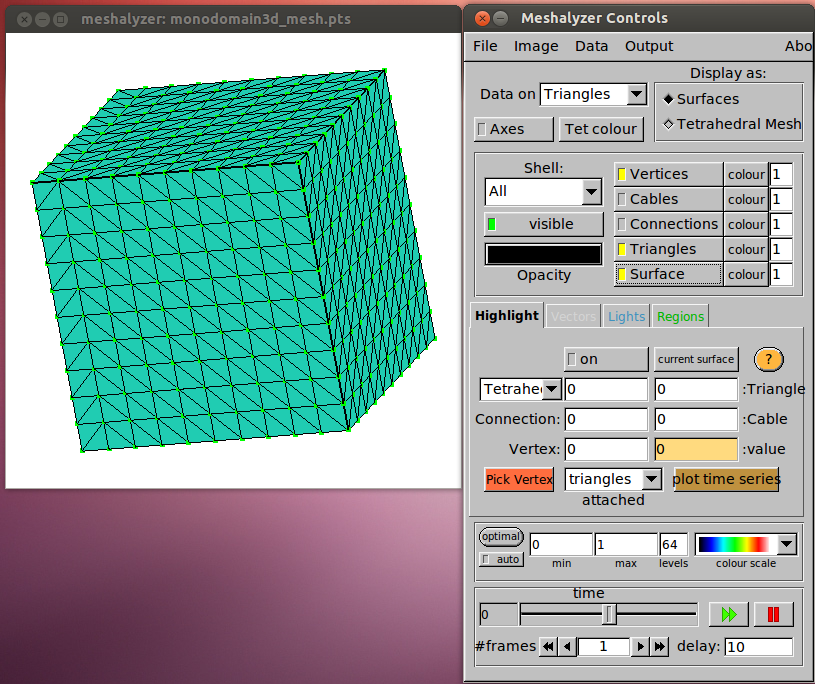
If you want to add connection between nodes, click on File –> Add Surface and
find your FILENAME_mesh.tri file. After doing this, you can click on the
“Surface” button in the Control Panel and see something like
So far, we only loaded up the geometry of the simulation. We now want to plot our results on the given geometry.
To do so, click on File –> Read Data and choose one of your FILENAME_VARIABLENAME.dat files
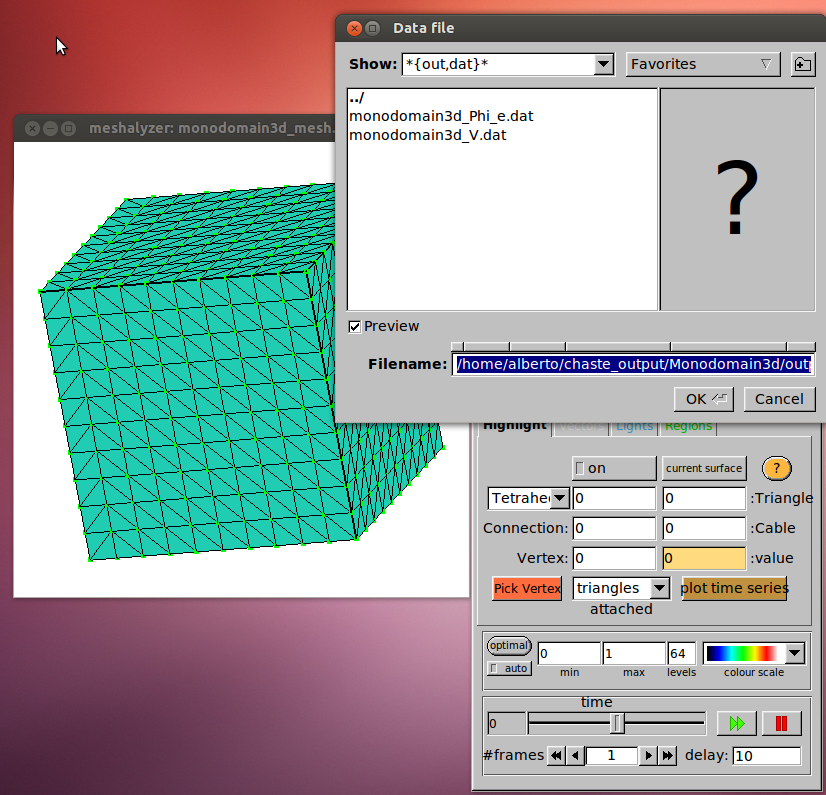
In this example, the Chaste simulation had two output variables (V and
Phi_e). Once you choose an output variable, the data will be plotted on the mesh. You can tune
where you want your data shown with the drop-down menu Data on near the top.
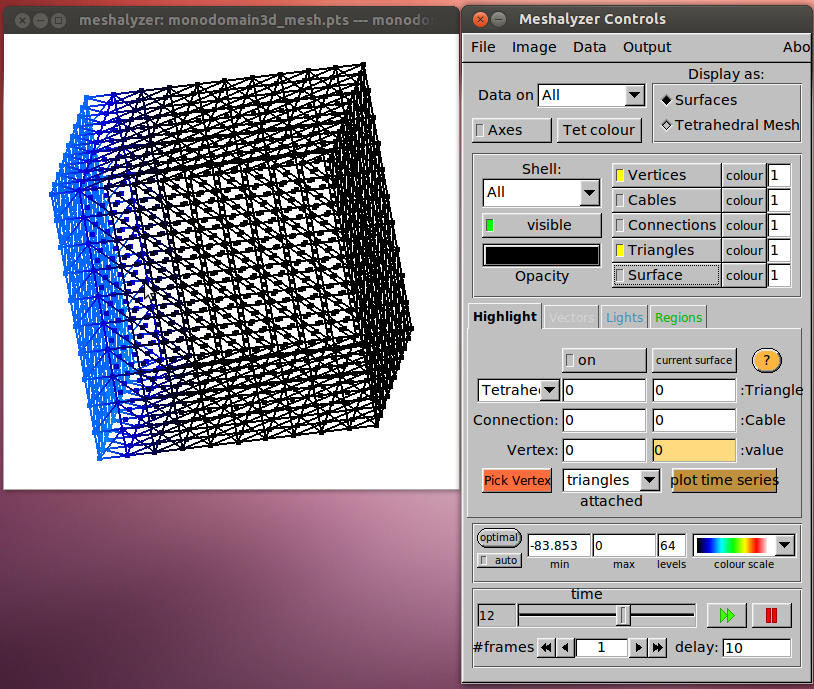
You can choose what you see by clicking the respective buttons. You can tune the
spectrum below by adjusting minimum and maximum and you can play your simulation
over time with the time player at the bottom. In the example below, you can see
the variable V plotted with a spectrum from -83.853 (min) to 0 (max) at time 12
of the simulation. It is visualized on triangles and connections. The surface
is hidden.
To export an image, click on Output and select the desired format (png, eps, pdf available).
To record a movie, click on Output –> Record –> Start and then start the animation (press the big double green arrow at the bottom). Meshalyzer will produce a sequence of images. Click on Output –> Record –> Stop when you are done.