Running a simulation with multiple-channel drug action
Getting the data
Download and save the attached file: DrugAction.tgz. Either use an Archive Manager to extract the contents to disk or save it and then unpack it with
tar xvfz DrugAction.tgzTagging conductances in a CellML file
Before performing drug action simulations with the executable, your CellML file must have the relevant ion-channel conductances tagged.
i.e. add a cmeta tag to the relevant variable:
<variable units="milliS_per_cm2" name="g_Kmax" public_interface="out" initial_value="0.282" cmeta:id="IKr_conductance"/>and then add the following RDF metadata description. This tells Chaste to convert the model leaving the parameter modifiable, and also tells Chaste what name to use - the name in the <bqbiol:is> tag is the one to use in the XML parameter file later. It MUST end in
_conductance(to ensure that only conductances are modified!).
<rdf:Description rdf:about="#IKr_conductance">
  <modifiable-parameter xmlns="https://chaste.comlab.ox.ac.uk/cellml/ns/pycml#">yes</modifiable-parameter>
  <bqbiol:is rdf:resource="https://chaste.comlab.ox.ac.uk/cellml/ns/oxford-metadata#membrane_rapid_delayed_rectifier_potassium_current_conductance"/>
</rdf:Description>
Understanding the XML parameters file
This tutorial is based upon 1D Propagation tutorial.
Open ChasteParameters.xml (it is sensible to do this in a web-browser or XML editor in order to get syntax highlighting). The file has been altered to add the following sections:
- physiological parameters:
- The following xml has been added, this specifies a drug concentration and IC50 values for (in this case) two ion-channels. You can use any units, but they need to be self-consistent (concentration in same units as IC50 values), if not specified the dose-response curve hill coefficient defaults to 1.
<!-- Parameters for drug action model -->
<ApplyDrug concentration="3">
    <!-- Current names should match those in the Oxford metadata -->
    <IC50 current="membrane_fast_sodium_current" hill="1.0">16000</IC50>

    <!-- Add action on a second channel -->
    <!-- Hill coefficient defaults to 1.0 -->
    <IC50 current="membrane_rapid_delayed_rectifier_potassium_current">5</IC50>
</ApplyDrug>- Here we named the currents which are to have their conductances modified - i.e. the name of the conductance tags WITHOUT
_conductanceon the end.
- post-processing:
- The following XML has been added:
<!-- Postprocessing parameters -->
<PostProcessing>
    <!-- Extract nodal time trace at node 200 -->
    <TimeTraceAtNode node_number="200"/>
</PostProcessing>
As we wish to record an action potential for comparing control and drug action.
Running the simulation
Change directory to DrugAction:
cd DrugActionIn this folder you will find the following files:
ChasteParameters.xml– this file describes the simulation, and can be used to override the default parameter values (in releases of the executable up to and including version 2.0, the default parameters were read in from another xml file,ChasteDefaults.xml).ChasteParameters_2_3.xsd– XML schema for input validation (in general never has to be altered or touched).
Run the simulation by doing
<path_to_chaste>/Chaste ChasteParameters.xmlA folder called
testoutputwill appear once the simulation has finished.
Visualising the results
Move into the newly created output folder
cd testoutput/ChasteResultsIn this folder you will find the following files and folders:
progress_status.txt– this file can be viewed whilst the simulation is running to gauge how long it will takeDrugActionResults.h5– the output of the simulation, in HDF5 formatNodalTraces_V.dat– voltage trace at node 200.output(folder) – contains the following files:DrugActionResults_mesh.pts– output converted into meshalyzer formatDrugActionResults_mesh.cnnx– output converted into meshalyzer formatDrugActionResults_V.dat– output converted into meshalyzer format
Move now into the Meshalyzer-compatible output folder
cd outputLaunch Meshalyzer with
<path_to_meshalyzer>/meshalyzer DrugActionResults_meshand visualise the results by loading the DrugActionResults_V.dat file.
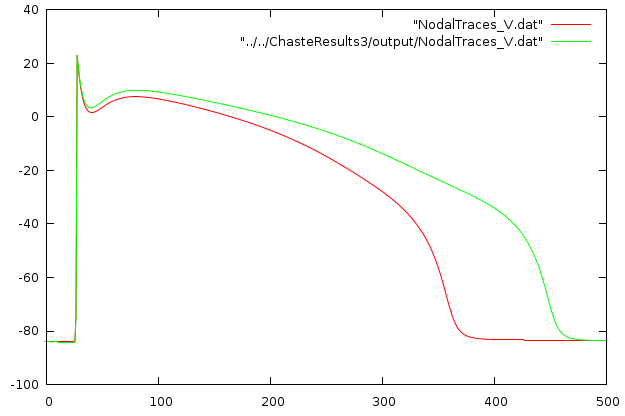
Or use gnuplot to look at the voltage trace
gnuplot
> plot "NodalTraces_V.dat"
You should then change the drug concentration to zero:
<!-- Parameters for drug action model -->
<ApplyDrug concentration="0">
    <!-- Current names should match those in the Oxford metadata -->
    <IC50 current="membrane_fast_sodium_current" hill="1.0">16000</IC50>

    <!-- Add action on a second channel -->
    <!-- Hill coefficient defaults to 1.0 -->
    <IC50 current="membrane_rapid_delayed_rectifier_potassium_current">5</IC50>
</ApplyDrug>
then re-run the simulation and compare results. You should observe the following:

