Profiling (Page still very much under construction!)
This page provides some information on profiling Chaste simulations, and assumes Chaste is being built using CMake. CMake is pre-configured to enable profiling with either the gnu profiler (gprof), or with google performance tools (gperftools).
Information on how to enable profiling can be found in the CMake Build Guide.
Examples in the following text are based on running Test2DVertexBasedCryptRepresentativeSimulation.hpp.
GProf
Running Test2DVertexBasedCryptRepresentativeSimulation.hpp generates the file Test2DVertexBasedCryptRepresentativeSimulation_simulation_.gmon in /path_to_build_directory/profile. This is a plain text file with first few lines
Each sample counts as 0.01 seconds.
  %   cumulative   self              self     total
 time   seconds   seconds    calls   s/call   s/call  name
 10.56     11.28    11.28 9354625363     0.00     0.00  boost::numeric::ublas::c_vector<double, 2ul>::operator()(unsigned long)
  7.86     19.68     8.40 1167048388     0.00     0.00  void boost::numeric::ublas::indexing_vector_assign<boost::numeric::ublas::scalar_assign, boost::numeric::ublas::c_vector<double, 2ul>, boost::numeric::ublas::vector_binary<boost::numeric::ublas::c_vector<double, 2ul>, boost::numeric::ublas::c_vector<double, 2ul>, boost::numeric::ublas::scalar_minus<double, double> > >(boost::numeric::ublas::c_vector<double, 2ul>&, boost::numeric::ublas::vector_expression<boost::numeric::ublas::vector_binary<boost::numeric::ublas::c_vector<double, 2ul>, boost::numeric::ublas::c_vector<double, 2ul>, boost::numeric::ublas::scalar_minus<double, double> > > const&)
  6.59     26.71     7.04 5256369461     0.00     0.00  unsigned long boost::numeric::ublas::same_impl_ex<unsigned long>(unsigned long const&, unsigned long const&, char const*, int)
This text output can be converted to a dot graph using several utilities (see the post-processing section).
Running gprof2dot.py -s -n1 -e1 Test2DVertexBasedCryptRepresentativeSimulation_simulation_.gmon | dot -Tsvg -o gprof.svg produces the following image:
GPerfTools
GPerfTools handles visualisation of the results itself, so changing any parameters must be done within ChasteMacros.cmake. Parameters to set are:
- --<ext> the file extension of the visualisation. The Chaste default is gif but others include svg, eps, and pdf.
- --nodefraction=x where x is the threshold below which nodes in the dot graph are not visualised. The Chaste default is 0.0001 (0.01% of total run time), but this can produce too much detail.
- --edgefraction=x where x is the threshold below which edges in the dot graph are not visualised. The Chaste default is 0.0001 (0.01% of total run time), but this can produce too much detail.
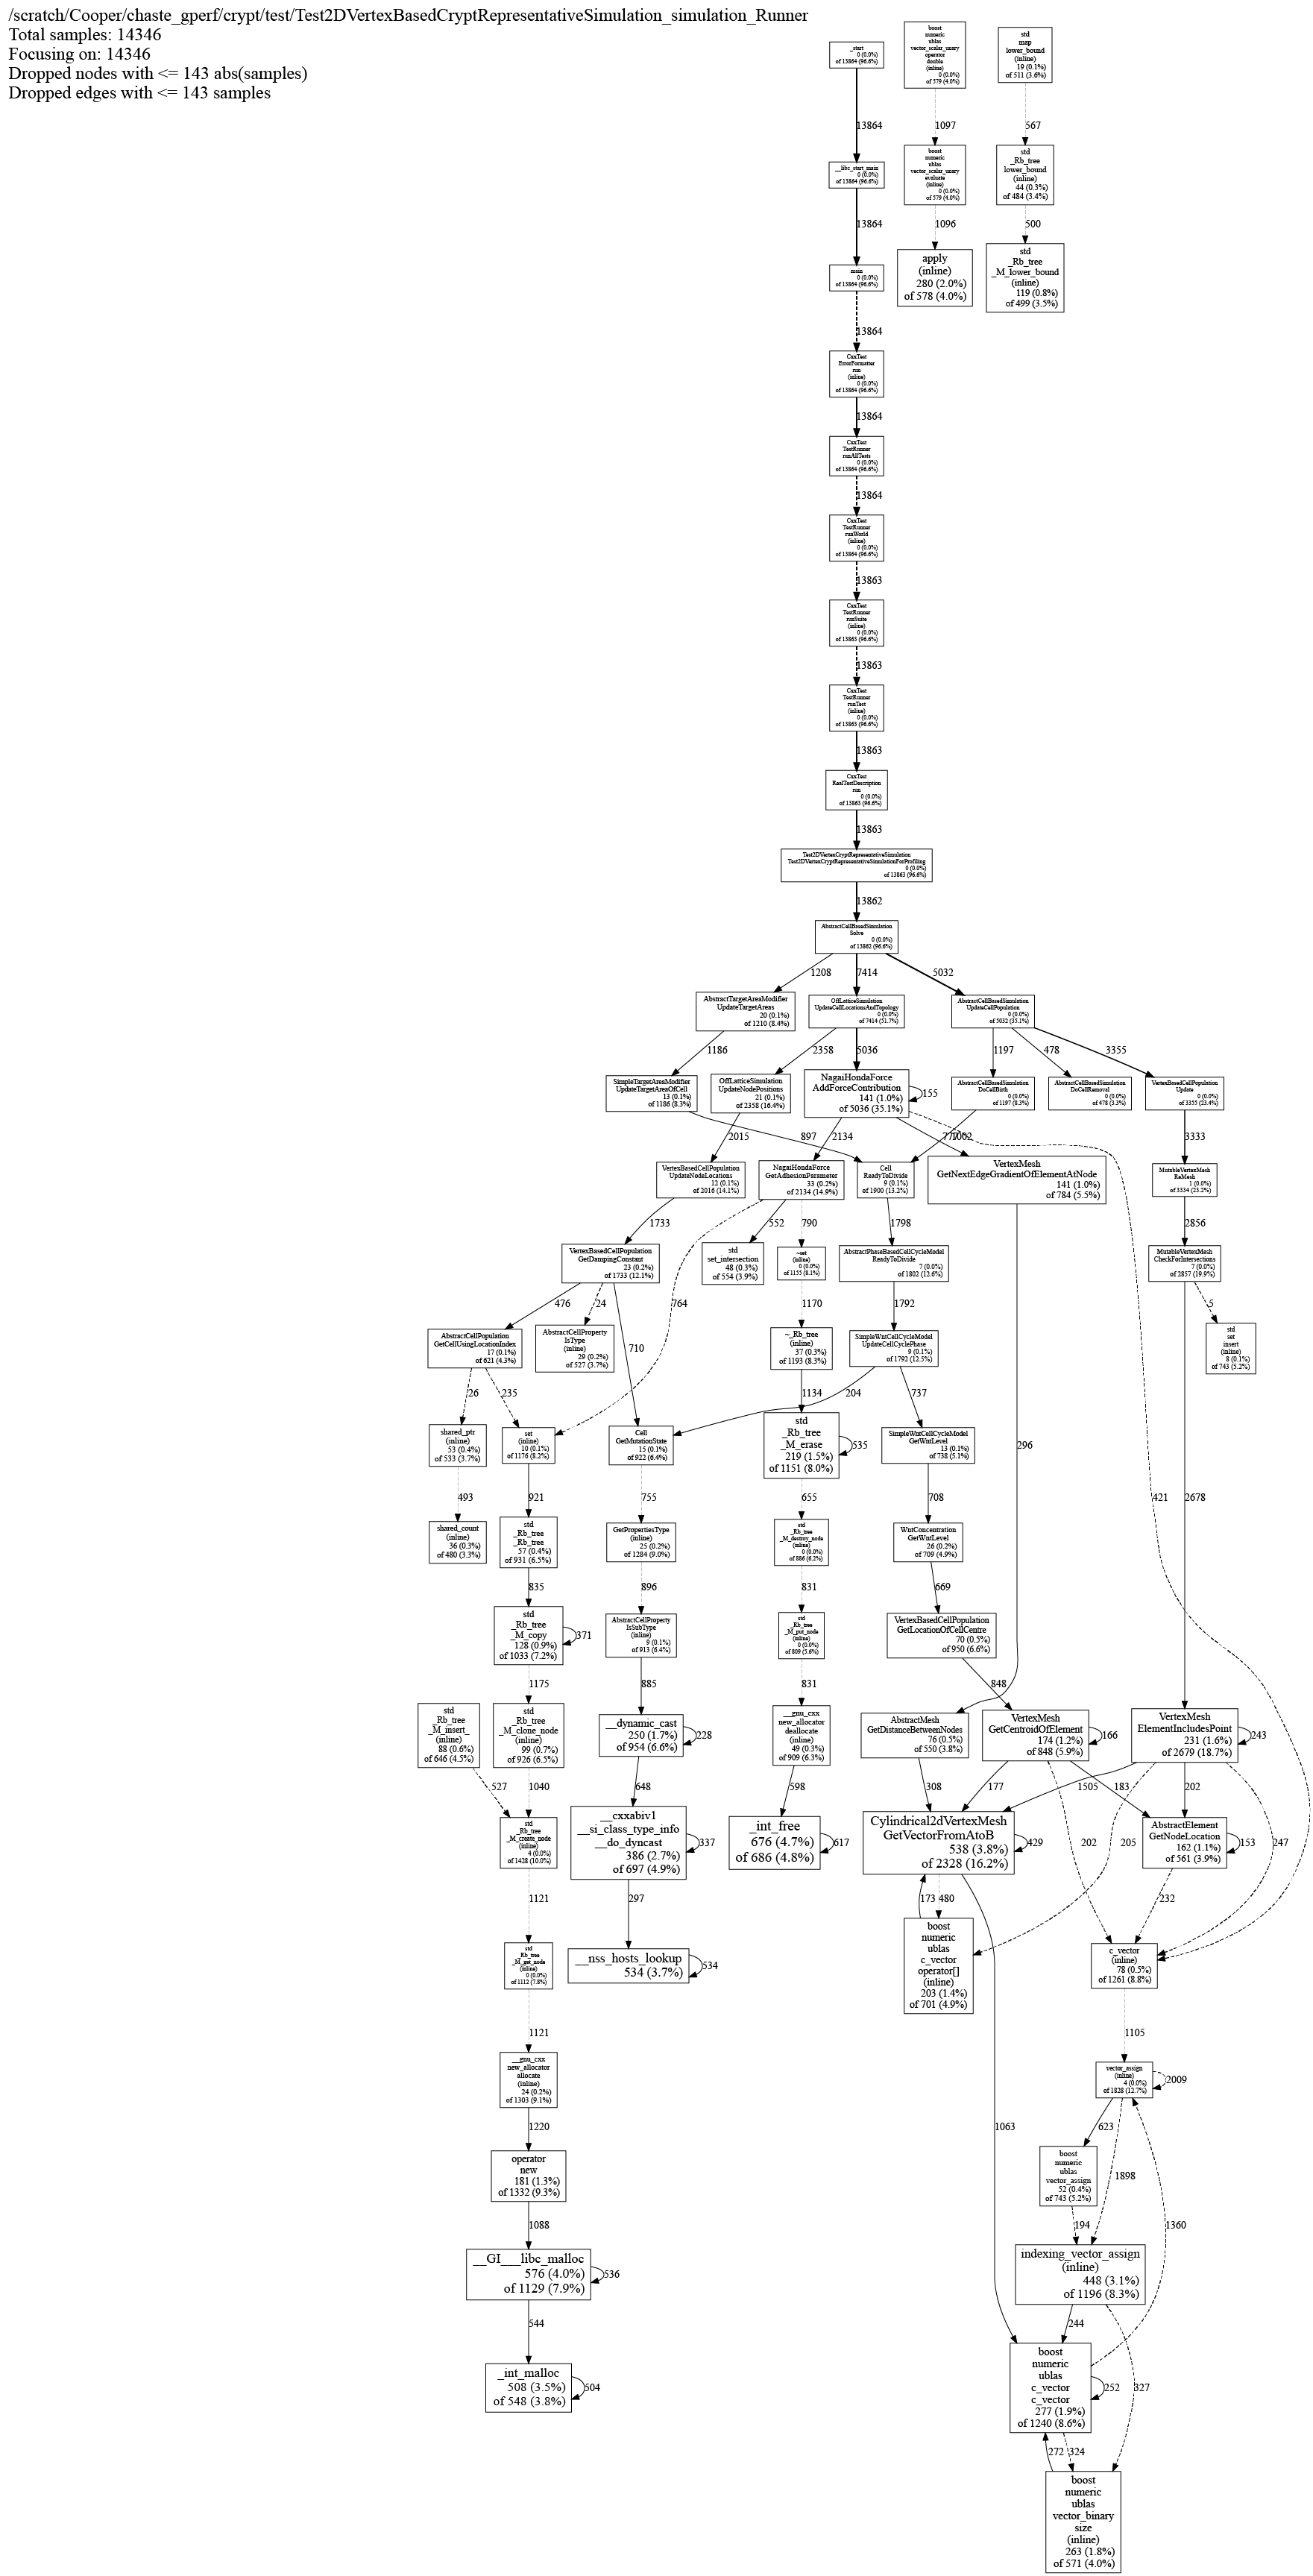
Running Test2DVertexBasedCryptRepresentativeSimulation.hpp with --svg --nodefraction=0.01 --edgefraction=0.01 generates two files in /path_to_build_directory/profile:
- Test2DVertexBasedCryptRepresentativeSimulation_simulation_.prof, a non human-readable output
- Test2DVertexBasedCryptRepresentativeSimulation_simulation_.svg, the image below (converted to png; original svg attached).
It is possible to post process results from GPerfTools using gprof2dot, however this requires setting the --<ext> flag to --callgrind, a format readable by gprof2dot.
Running gprof2dot.py -f callgrind -s -n1 -e1 Test2DVertexBasedCryptRepresentativeSimulation_simulation_.cg | dot -Tsvg -o gperftools_modified.svg produces the following image:
Post-processing the profiling results
gprof2dot is a great utility for producing dot graphs from multiple different profilers.
Example usage is gprof2dot.py -f <format> <other options> | dot -T<ext> -o output.<ext>, where
- <format> defaults to prof, which is the default .gmon file produced by gprof, but above is used as callgrind for using gperftools
- <other options> include:
- -s to strip function arguments and template information, without which the boxes are often too wide
- -nx the node threshold (where x is the percent of total run time), below which nodes are not visualised
- -ex the edge threshold (where x is the percent of total run time), below which edges are not visualised
- <ext> is the output format and can be, for instance, svg, eps, pdf, or png

